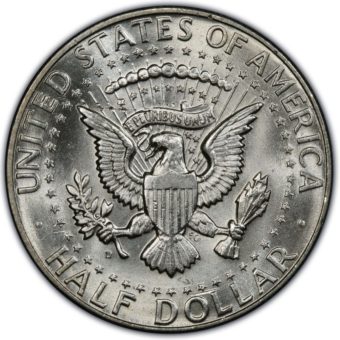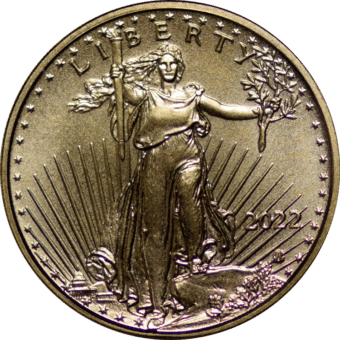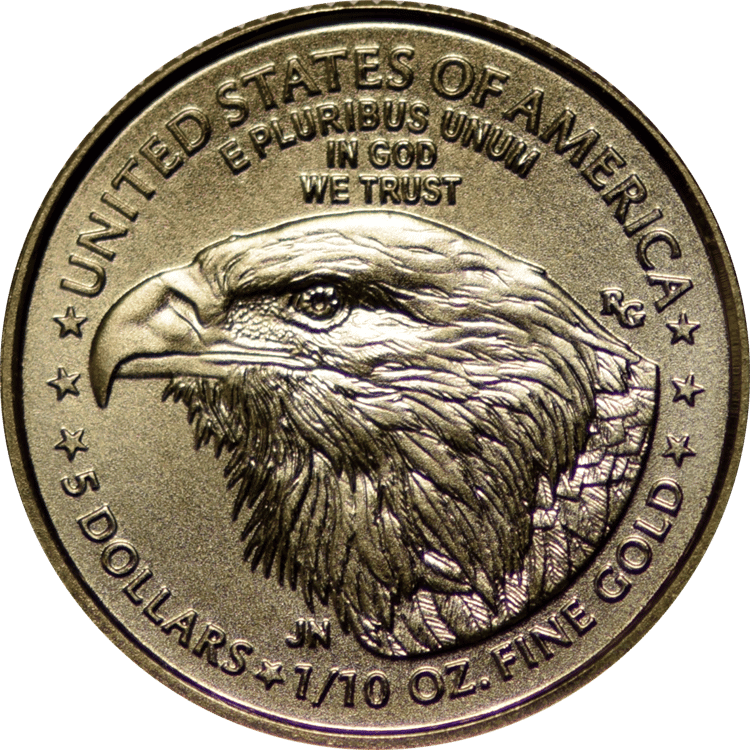
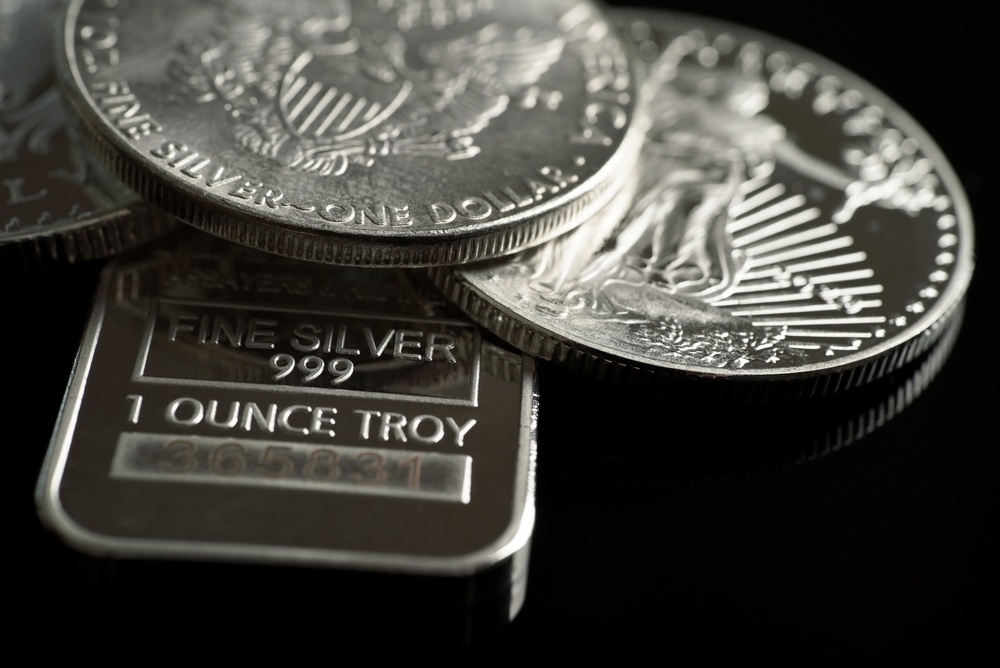
Markets didn’t get a full trading week, but they still got plenty to digest. Gold, silver, oil, inflation, GDP, and the Fed all pulled on the same thread — and next week’s jobs report could decide which way that thread snaps.
Monday (5.25.26): U.S. markets were closed for Memorial Day, so there were no official closing prices for gold or silver. Metals got a pause button, but macro did not. Iran, Hormuz, oil, the dollar, and Fed-rate expectations were still waiting in the wings.
Tuesday (5.26.26): Gold closed near $4,510.37, while silver finished around $76.944. Gold stayed mostly steady after the long weekend, while silver got more of the spotlight as traders weighed Hormuz deal hopes, energy-price pressure, and a still-cautious Fed backdrop.
Wednesday (5.27.26): Gold dropped to $4,455.91, while silver slid to $74.286. Metals took a step back as optimism around U.S.–Iran negotiations trimmed safe-haven demand. Rate concerns kept gold restrained, while silver also felt pressure from industrial-demand worries.
Thursday (5.28.26): Gold rebounded to $4,493.81, while silver climbed to $75.72. Weak Q1 GDP, a softer dollar, and cooler monthly core PCE gave metals buyers a better setup. Not a parade — more like a clean rebound with coffee in hand.
Friday (5.29.26): Gold traded near $4,528.90, while silver hovered around $75.475. Gold found support from lower oil, softer Treasury yields, and a weaker dollar. Silver lagged below short-term resistance near $76.00–$76.50, making gold the steadier player while silver kept testing the door.
—
Core inflation holds at 3.3% as the Fed’s favorite price gauge keeps wallets on watch
The big picture
Inflation did not make a dramatic entrance in April, but it also did not exit the building. The Fed’s preferred inflation measure showed core PCE rising 3.3% year over year, matching expectations. The monthly reading cooled slightly, which gave markets a small dose of optimism — but likely not enough to push the Fed into a quick policy shift.
Driving the news
Core PCE prices rose 0.2% in April and 3.3% from a year earlier. Headline PCE rose 0.4% for the month and 3.8% annually. The annual numbers landed in line with forecasts, while the softer monthly readings suggested March’s price pressure may be easing. Still, inflation remains above the Fed’s 2% target, which keeps higher-for-longer rate talk very much alive.
By the numbers
- 3.3% — annual core PCE inflation rate in April
• 0.2% — monthly increase in core PCE prices
• 3.8% — annual headline PCE inflation rate
• 1.6% — revised annualized GDP growth rate for Q1
• 2.6% — personal savings rate, the lowest since June 2022
Why it matters
This report gave the Fed a mixed plate. Inflation is still above target, but the monthly pace cooled. Consumers are still spending, but income was flat. Durable goods orders jumped, but GDP growth was revised lower. The quick read: the economy is still moving, but some of that motion may be coming from thinner household cushions instead of stronger income.
What to watch
- Core PCE inflation
• Consumer spending
• Personal savings rate
• Jobless claims
• Fed rate expectations
The bottom line
April’s inflation report was not a blowout problem, but it was not a clean win either. Prices are still rising faster than the Fed wants, consumers are still spending, and savings are being tapped. For now, the Fed’s message likely stays simple: patient, cautious, and not ready to celebrate.
—
Gold rebounds as weak GDP gives metals a lift despite Hormuz tension
The big picture
Gold caught a bid Thursday as weaker U.S. growth, a softer dollar, and cooler monthly core inflation gave metals buyers a cleaner entry point. The twist: inflation is still elevated, oil remains sensitive to headlines, and the Strait of Hormuz continues to sit near the center of the market’s geopolitical dashboard.
Driving the news
Spot gold rose near $4,495 an ounce, up 0.89%, while silver climbed to about $75.530, up 1.35%. The move followed a downward revision in first-quarter GDP to 1.6% from 2.0%, suggesting the U.S. economy may be losing some speed. That softer growth helped offset inflation concerns tied to energy-market stress and geopolitical uncertainty.
By the numbers
- $4,495.00 — spot gold price at the time of writing
• $75.530 — spot silver price at the time of writing
• 1.6% — revised Q1 U.S. GDP growth rate
• 4.48% — 10-year Treasury yield
• 99.16 — U.S. Dollar Index level
Why it matters
Gold tends to like weaker growth, softer yields, and a softer dollar — and Thursday offered a little of each. But the setup is still layered. If Hormuz tensions cool, oil could ease and inflation pressure may soften. If tensions rise, crude, inflation expectations, and the dollar could all move higher together, which can complicate the backdrop for non-yielding metals.
What to watch
- Gold resistance near $4,589–$4,631
• Silver resistance near $76.14–$78.00
• U.S. Dollar Index
• Crude oil prices
• Fed rate expectations
The bottom line
Gold bounced because growth looked softer, the dollar eased, and traders saw a better setup for metals. But this was not a clean “all clear” moment. It was more like gold finding its footing while oil, inflation, Fed policy, and Hormuz headlines all stayed on the same watchlist.
—
Why Bank of America Is Bullish on Silver Prices
The big picture
Silver may still have a path to triple digits, according to Bank of America. The bank says prices could reach $100 an ounce by the fourth quarter if gold rallies and investor demand strengthens. The catch: BofA does not expect that level to hold for long, because higher prices may push industrial users to reduce silver usage.
Driving the news
Bank of America analysts, led by Michael Widmer, said silver could climb above $100 an ounce in the coming months, but they expect prices to move back toward $75 by the second quarter of 2027. Their concern is that silver’s industrial-demand story may soften as solar manufacturers and other users look to thrift, substitute, or engineer around higher silver costs.
By the numbers
- $100 — BofA’s possible silver target for Q4 2026
• $75 — BofA’s forecast for silver by Q2 2027
• 90% — possible decline in the silver deficit this year
• 6 years — expected supply-deficit streak
• 59.43 — current gold/silver ratio
Why it matters
Silver plays two roles at once: precious metal and industrial workhorse. When investors show up, silver can move quickly. But when prices rise too far, manufacturers may start looking for cheaper alternatives or ways to use less of it. That means silver’s next major move may depend more on investor demand, gold’s momentum, and trade-policy headlines than on factory demand alone.
What to watch
- Silver near $100 an ounce
• Silver holding above $75
• Gold’s rally momentum
• Physical silver demand
• Industrial substitution trends
The bottom line
BofA’s silver call is bullish, but measured. The bank sees a possible road to $100, not a permanent new price floor. For investors, silver remains the livelier cousin of gold: more industrial exposure, more volatility, and plenty of upside when momentum shows up.
—
Americans are drawing down savings as energy costs hit wallets
The big picture
The U.S. consumer is still spending, but the funding mix is getting more interesting. The personal saving rate fell to 2.6% in April, its lowest level since mid-2022, as households spent faster than incomes grew. That keeps the economy moving for now, but it also makes the consumer picture look more stretched.
Driving the news
Americans increased spending by 0.5% in April even as disposable personal income fell 0.1%. That gap matters. Consumers are still buying, but some appear to be leaning more on savings to do it. Gasoline and energy goods were among the biggest drivers of spending increases, showing how energy costs can move from global headlines straight into household budgets.
By the numbers
- 2.6% — personal saving rate in April
• 0.5% — increase in consumer spending
• -0.1% — change in disposable personal income
• 3.3% — annual core PCE inflation rate
• -1.4% — decline in real per capita disposable income
Why it matters
Consumer spending has been one of the economy’s key stabilizers. But when spending rises while income slips, the cushion can get thinner. The optimistic read is that consumers remain resilient. The more cautious read is that households are stretching. April’s energy-driven spending makes that second read worth watching.
What to watch
- Personal saving rate
• Consumer spending
• Disposable personal income
• Energy prices
• Consumer sentiment
The bottom line
Americans are still spending, driving, and keeping the economy moving. But savings are sliding, real incomes are under pressure, and energy costs are taking a larger bite. The consumer engine is still running — it just may be using more backup fuel than before.
—
ECONOMIC CALENDAR
MONDAY, JUNE 1
- 10:00 am — ISM Manufacturing (May)
• 11:50 pm — Minneapolis Fed President Neel Kashkari Speech in South Korea
TUESDAY, JUNE 2
- 8:55 am — Cleveland Fed President Beth Hammack Speech
• 10:00 am — JOLTS (April)
WEDNESDAY, JUNE 3
- 8:15 am — ADP Employment (May)
• 10:00 am — ISM Services (May)
THURSDAY, JUNE 4
- 8:30 am — Initial Jobless Claims (May)
• 8:30 am — U.S. Productivity (Q1)
FRIDAY, JUNE 5
- 8:30 am — U.S. Employment Situation Summary (Jobs Report)
IMPACT ON PRECIOUS METALS MARKETS
MONDAY, JUNE 1
ISM Manufacturing (10:00 am ET)
- Stronger manufacturing data → suggests industrial resilience and possible inflation pressure; mildly bearish for gold/silver.
• Weaker manufacturing data → points to slowing demand and possible economic stress; bullish for metals.
• ISM manufacturing can influence Treasury yields, the U.S. dollar, and growth expectations, though manufacturing is a smaller share of the U.S. economy than services; moderate impact.
Minneapolis Fed President Neel Kashkari Speech in South Korea (11:50 pm ET)
- Hawkish comments → support higher-for-longer rate expectations and Treasury yields; bearish for gold/silver.
• Dovish comments → strengthen expectations for eventual Fed easing; bullish for metals.
• Fed speeches can affect precious metals when they shift market expectations around inflation, rate cuts, or monetary-policy timing; moderate impact.
TUESDAY, JUNE 2
Cleveland Fed President Beth Hammack Speech (8:55 am ET)
- Hawkish comments → suggest the Fed may remain cautious on rate cuts; bearish for gold/silver.
• Dovish comments → suggest greater openness to easing if inflation cools or labor weakens; bullish for metals.
• Fed commentary can move the U.S. dollar and Treasury yields, both of which are major drivers of precious metals prices; moderate impact.
JOLTS (10:00 am ET)
- Higher job openings → suggest labor-market resilience and possible wage pressure; bearish for gold/silver.
• Lower job openings → signal cooling labor demand and rising slowdown risks; bullish for metals.
• JOLTS helps markets assess labor-market tightness, wage inflation, and Fed policy expectations; moderate to high impact.
WEDNESDAY, JUNE 3
ADP Employment (8:15 am ET)
- Strong ADP employment → points to resilient private-sector hiring; mildly bearish for gold/silver.
• Weak ADP employment → suggests labor-market cooling ahead of the official jobs report; bullish for metals.
• ADP can influence expectations before Friday’s jobs report, though its signal is imperfect and often revised by the market after official payrolls; moderate impact.
ISM Services (10:00 am ET)
- Strong services activity → suggests economic resilience and possible services inflation pressure; bearish for gold/silver.
• Weak services activity → points to slowing growth and possible recession risk; bullish for metals.
• ISM services is highly watched because services dominate the U.S. economy and remain central to the inflation outlook; high impact.
THURSDAY, JUNE 4
Initial Jobless Claims (8:30 am ET)
- Rising claims → signal labor-market softening and economic slowdown risks; bullish for gold/silver.
• Falling claims → indicate continued labor-market resilience; mildly bearish for metals.
• Weekly jobless claims are one of the fastest indicators of labor-market conditions and can quickly influence Treasury yields, the U.S. dollar, and rate expectations; moderate impact.
U.S. Productivity (8:30 am ET)
- Stronger productivity → suggests the economy can grow with less inflation pressure; mixed to mildly bearish for gold/silver.
• Weaker productivity → raises concerns about labor-cost pressure and sticky inflation; potentially bearish for metals if it supports higher rates.
• Productivity affects how markets interpret growth, wages, inflation, and corporate margins, but it usually has less immediate market impact than jobs or inflation data; low to moderate impact.
FRIDAY, JUNE 5
U.S. Employment Situation Summary / Jobs Report (8:30 am ET)
- Stronger jobs and wage growth → support higher-for-longer rate expectations and Treasury yields; bearish for gold/silver.
• Weaker jobs and wage growth → raise slowdown concerns and strengthen the case for eventual Fed easing; bullish for metals.
• The jobs report is one of the most important monthly economic releases because it can quickly reshape expectations for Fed policy, Treasury yields, the U.S. dollar, and safe-haven demand; very high impact.
—
Continue Learning With Prime Asset
Markets move fast, but smart investors stay grounded. For more insights on gold, silver, inflation, and the forces shaping precious metals, continue learning with Prime Asset on our website.